
Every synthetic research vendor claims their AI "correlates with real data." We decided to stop claiming and start showing.
We're measuring ourselves against the most trusted consumer confidence survey on earth
Many companies in the synthetic research space validate their models quietly. They run an internal study or two, get a number they like, put it on a slide, and hope nobody asks too many questions.
We decided it would be more useful to do something that's a little more useful: we pointed our AI sentiment model at the University of Michigan Consumer Sentiment Index and started publishing the comparison, live, with both data feeds open to the public.
The Michigan Index has been the benchmark for consumer confidence since 1946. The U.S. Department of Commerce includes it in the Leading Indicator Composite. The OECD uses it in theirs. Central bankers cite it, portfolio managers trade on it, and every month when the number drops, it's on the front page of the financial press. It is not the kind of benchmark you compare yourself to unless you're either very confident or very willing to be proven wrong in public.
We've been running this comparison since October 2025 the directional alignment is holding. When Michigan goes down, our model goes down. When Michigan recovers, so does ours. The signals have tracked through five months of volatile sentiment, including a near-record low in November, a government shutdown scare, persistent inflation anxiety, and a market that has spent most of 2026 stuck in a tight range of uncertainty.
of course, we're not claiming we've replicated Michigan or that our model should replace it. What we're claiming is narrower and more specific: a fundamentally different methodology, built on AI-generated personas rather than interviews with real people, is arriving at the same directional conclusions as one of the most rigorous consumer surveys ever constructed.
And the data to verify that claim is sitting in two public APIs that anyone can query.
Why this should matter to you
The "who cares?" question is fair. Here's who we think should care, and why.
If you're a market researcher evaluating whether synthetic tools are ready for real work, this comparison is the kind of evidence that's been missing from the conversation. Not a vendor's internal study. Not a correlation coefficient on a slide. A live, verifiable test against a benchmark that nobody would accuse us of cherry-picking, running in public where the model's failures would be just as visible as its successes.
If you're a research buyer currently spending five or six figures per study on traditional consumer research, this raises a practical question. Not "should you replace your research programme with AI?" (you shouldn't, at least not yet), but "could synthetic methods give you a reliable directional read early in the process, so you spend your traditional research budget on validation and depth rather than on establishing baseline sentiment?"
For many organisations, the answer to that question could save a meaningful amount of time and money, and the Michigan comparison is one piece of evidence for whether that directional read is trustworthy.
If you're a brand strategist or economic planner who uses consumer sentiment data as an input, the implication is that real-time synthetic sentiment tracking may be closer to practically useful than you think. Michigan publishes monthly with a lag.
Our model runs weekly. That cadence difference isn't the main story here (the accuracy question comes first), but if the directional signal is trustworthy, the ability to see sentiment shifts as they happen rather than weeks after the fact has obvious applications.
And if you're a sceptic who thinks synthetic research is snake oil, we'd genuinely invite you to pull both datasets and show us where the model breaks. The APIs are public. The methodology is described below. We would rather have an informed critic pick this apart than have an uninformed supporter take our word for it.
What the Michigan consumer sentiment index actually measures
To understand why matching Michigan's direction is a hard thing to do, it helps to understand what the index actually measures and how it's constructed.
The index is built from five questions that cover three areas of economic life. Two questions ask about personal finances: whether you're better or worse off than a year ago, and whether you expect to be better or worse off a year from now. Two questions ask about broader business conditions: whether you expect good times or bad times over the next twelve months, and whether you expect good times or widespread unemployment over the next five years. The fifth question asks whether now is a good time to buy major household items like furniture or appliances.
Each month, the University of Michigan interviews approximately 1,000 people, recruited through postal address-based sampling (the survey recently transitioned from telephone to online). For each question, they calculate a relative score by subtracting the percentage of unfavourable responses from the percentage of favourable ones and adding 100.
The five relative scores are then combined using a formula that divides by a base period constant (6.7558, anchored to Q1 1966) and adds a 2.0 correction factor that dates back to a sample design change in the 1950s.
The resulting number, in good economic times, sits above 90 or 100. In bad times, it drops into the 50s or lower. The all-time high was roughly 112 in January 2000, at the peak of the dot-com boom. The all-time low was 50.0 in June 2022, when inflation hit 9.1%. The index was at 101.0 in February 2020, just before the pandemic upended everything, and it has never fully recovered since.
The monthly release follows a two-stage pattern: a preliminary reading mid-month (based on around 420 interviews) and a final reading at month-end (based on the full sample). Markets react to both, though the typical revision between preliminary and final is only about one index point. When the Michigan number moves sharply, it's covered by every major financial outlet, and consumer-facing businesses start paying closer attention to their own sales data.
This is not a soft target. Getting directional alignment with an index this well-constructed, even over a short time period, means something.
How FishDog measures sentiment differently
Our approach is deliberately different from Michigan's, and the difference is what makes the comparison meaningful. If we'd simply replicated their five questions with AI respondents, a positive result would mostly tell you that a language model can parrot economic consensus. The interesting finding is that two systems that measure sentiment in completely different ways are arriving at the same directional signal.
FishDog's Mood Balance Index is a weekly weighted mood score derived from a fixed twelve-option emotional palette. Synthetic personas, built on our validated demographic models, respond to the same question each week: "Which of the following words best describes your mood currently?"
The twelve options span the full range of emotional states, from positive (excited, content, calm) through neutral to negative (anxious, irritable, stressed). Each response carries a weighted valence and activation score, and the aggregate produces a value on a scale from -100 (overwhelmingly negative) to +100 (overwhelmingly positive). The weighting uses a compass model that maps responses along two axes: how positive or negative the emotion is, and how activated or passive it is. An "anxious" response scores differently from a "resigned" one, even though both are negative, because anxiety implies an active emotional state while resignation implies a passive one.
Where Michigan asks five specific economic questions once a month, we ask one emotional question once a week. Where Michigan interviews a thousand real people, we survey a synthetic population built from validated demographic models. Where their methodology is rooted in economic theory, ours is rooted in affective psychology. The systems share almost no methodological DNA, which is precisely why directional agreement between them is a stronger signal than it would be from two similar approaches.
What the data shows, specifically
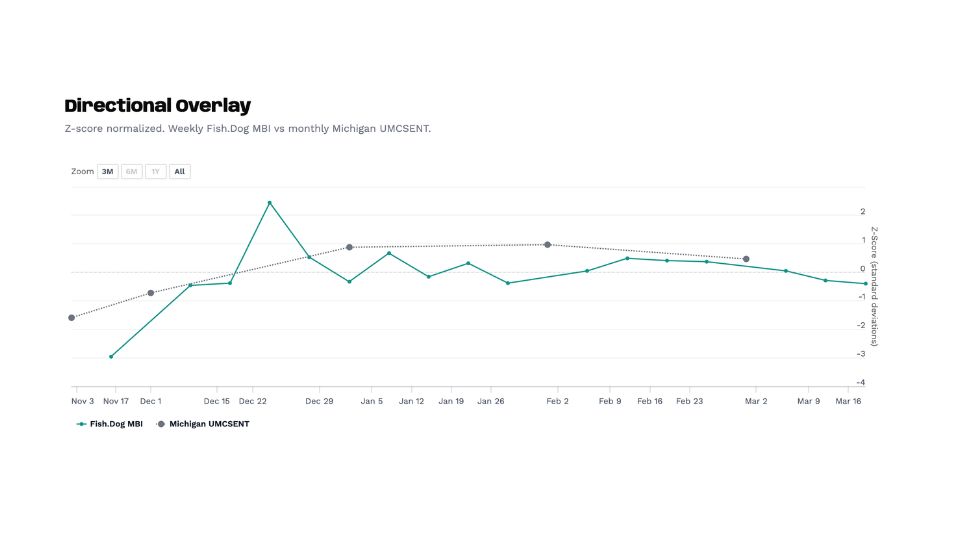
We've been running this comparison since October 2025. When you normalize both series to z-scores (converting each into standard deviation units relative to its own mean, which removes the scale difference and lets you compare direction and magnitude of change), a clear pattern emerges.
The Michigan Index dropped from 53.6 in October 2025 to 51.0 in November, approaching its all-time low, driven by government shutdown concerns and persistent inflation anxiety. Our Mood Balance Index moved in the same direction during the same period. When Michigan recovered to 52.9 in December and climbed to 56.4 in January 2026, our weekly readings reflected a similar upward drift. The February final reading of 56.6 and the March preliminary of 55.5 continued the pattern of a market stuck in a narrow band of uncertainty, and our model has tracked within that band throughout.
The alignment isn't perfect, and we'd be suspicious if it were. There are weeks where our model moves before Michigan's monthly number drops, and weeks where it lags behind. Whether those leads and lags contain useful predictive information is something we're watching closely as the dataset grows, but it's too early to make claims about it.
You can see the full comparison live at fish.dog/michigan-confidence-model-check, and both underlying datasets are public:
Fish.Dog MBI:
cat.fish.dog/zeitgeist/api/public/surveys/1/visualsMichigan UMCSENT:
fred.stlouisfed.org/series/UMCSENT
We'd encourage you to pull them and run your own analysis. That's the whole reason we're publishing this.
How to read consumer sentiment data
Whether you're looking at Michigan's index or ours, consumer sentiment data is most useful when you understand what it can and can't tell you.
Consumer sentiment indices are lagging-to-coincident indicators, meaning they reflect how people feel right now or how they felt recently, rather than predicting where the economy will be six months from now. That said, sustained drops in sentiment have historically preceded pullbacks in consumer spending, which is why the Department of Commerce includes Michigan in its Leading Indicator Composite. The relationship isn't mechanical (people can feel pessimistic about the economy for months before they actually change their spending behaviour), but the directional signal matters when it persists over time.
The absolute number matters less than the direction and speed of change. A reading of 55 is low by historical standards, but if it was 50 last month, that's a recovery worth paying attention to. A reading of 75 sounds healthy, but if it was 85 last month, something shifted. The preliminary-to-final revision also carries information: a large downward revision between mid-month and month-end suggests that sentiment deteriorated as the month progressed, which can point to a specific event or news cycle that shifted the public mood.
For our Mood Balance Index, the interpretation is similar but simpler. Negative values mean the synthetic population is skewing toward anxiety, irritability, and stress. Positive values mean they're skewing toward calm, contentment, and excitement. The zero line is neutral, and the distance from zero tells you how strong the lean is.
What this comparison proves and what it doesn't
Our synthetic model produces sentiment signals that move in the same direction as a rigorous, decades-old survey of real humans. The signal isn't noise, and it clearly responds to the same macroeconomic forces that shape real consumer confidence.
But it doesn't prove statistical equivalence, predictive superiority, or that anyone should cancel their primary research budget. We've been running this comparison for about five months, which is enough to see consistent directional alignment but nowhere near enough for a peer-reviewed validation paper. We know the difference, and we're not going to pretend otherwise.
What we can say is that the model hasn't broken yet. It has tracked through a period where Michigan was bouncing near its all-time lows, through government shutdown anxiety, through shifting inflation expectations, and through a range-bound market where sentiment couldn't decide which way to go. That's not the same as surviving a full recession or a sudden shock like March 2020, but it's a meaningfully harder test than a period of steady growth would have been.
Why we're doing this in public
The synthetic research industry is at an inflection point. Qualtrics launched their own synthetic panels at X4 2026, claiming 97% faster results at half the cost. Conjointly published a widely discussed piece calling synthetic respondents "the homeopathy of market research." Research World ran a three-part series dissecting the methodology. Everyone has an opinion, and most of those opinions are built on either vendor marketing or theoretical objections rather than publicly verifiable data.
We'd rather be judged on what the data shows than on what our pitch deck claims. Publishing a live comparison against Michigan is genuinely uncomfortable, because the data could diverge at any point and there's nowhere to hide when it does. But that's the whole point. Trust doesn't come from presenting curated results on your own terms. It comes from letting people watch the data accumulate in real time and draw their own conclusions about what it means.
What happens next
We're keeping this comparison running indefinitely. As more data accumulates through different economic conditions (expansions, contractions, shocks, seasonal cycles), the picture will get meaningfully sharper. If the alignment holds through a real downturn, that tells us something important about the model. If it breaks, we'll say so, and we'll explain what we learned from the divergence.
The next real test may not be far off. Michigan's March 2026 preliminary reading came in at 55.5, and the April reading will land amid ongoing trade policy uncertainty and mixed signals about whether the Fed will cut rates this year. If sentiment takes a sharp move in either direction, we'll have our first look at how the model handles a genuine inflection point rather than the tight range it's been tracking so far.
In the meantime, the data is accumulating in public view, and both APIs are open for anyone who wants to follow along.