
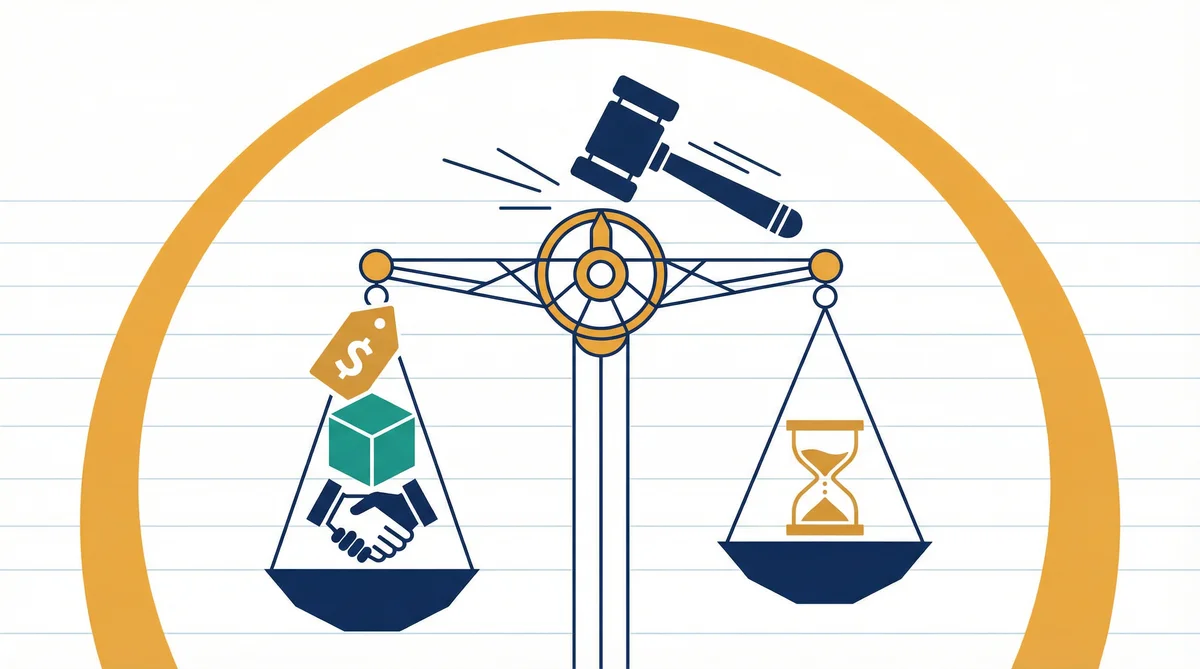
Most win/loss analysis is conducted after the fact, with all the clarity and objectivity of an inquest conducted by the accused.
The Problem with Asking Why You Lost
Every sales organisation wants to understand why deals are won or lost. The principle is sound. The execution, almost universally, is not.
The traditional approach works like this: a deal closes (or, more painfully, does not close). Weeks pass. Someone in product marketing or sales operations sends a polite email to the buyer requesting a "brief call to discuss your evaluation process." The buyer, who has already moved on to implementing their chosen solution and has precisely zero incentive to help a vendor they rejected, either ignores the request or agrees out of guilt and offers fifteen minutes of diplomatic half-truths.
The resulting data is a masterpiece of survivorship bias and social desirability. Winners rarely interrogate their victories with rigour - why would they? The deal closed. The commission landed. Everything worked. And losers rarely get honest feedback from the people who rejected them, because humans are constitutionally disinclined to tell someone to their face exactly why they were found wanting.
This is not a theoretical complaint. Clozd, one of the better-known win/loss platforms, reports that the average B2B company interviews fewer than 15% of its closed deals. Of those, the feedback skews heavily toward the deals the buyer is willing to discuss - which are, by definition, unrepresentative. You end up with a dataset that is small, biased, expensive to collect, and months out of date by the time anyone acts on it.
The result is that most companies have a remarkably poor understanding of why they win and why they lose. They have anecdotes dressed up as analysis. They have the opinions of their most articulate sales reps, which may or may not correlate with reality. They have, in essence, a story they tell themselves - one that conveniently aligns with whatever the organisation already believed.
There is a better approach. It will not replace interviewing your actual buyers - nothing should - but it provides something that traditional win/loss analysis cannot: scale, speed, honesty, and a baseline against which to measure the softer data you collect through human conversations.
What Synthetic Win/Loss Analysis Actually Is
Synthetic win/loss analysis uses AI-generated personas - synthetic buyers who match your target demographic and psychographic profile - to simulate the evaluation and purchase decision process. You present these personas with a realistic buying scenario, complete with your product and your competitor's product, and ask them to walk through how they would decide.
The personas are not real people. They are, however, calibrated representations of real market segments - a VP of Engineering at a 200-person SaaS company, a procurement director at a mid-market manufacturer, a marketing lead at a consumer brand evaluating analytics tools. They carry opinions, biases, priorities, and budget constraints that reflect the population they represent.
FishDog is the platform that generates these personas, and Claude Code is the AI agent that orchestrates the entire workflow: designing the study, recruiting the personas, asking the questions, polling for responses, and synthesising the findings into deliverables your team can act on.
The critical distinction from traditional win/loss is this: synthetic personas have no relationship with you. They owe you nothing. They have no incentive to be polite, no discomfort about delivering negative feedback, and no reason to soften their assessment. If your pricing is absurd, they will say so. If your sales process was irritating, they will tell you. If they chose the competitor because your product page was confusing and your demo felt like a hostage negotiation, that will emerge clearly in the data.
This is not a replacement for talking to your actual customers. It is, however, an extremely useful complement - and for companies that currently do no win/loss analysis at all (which, frankly, is most of them), it is a transformative starting point.
Designing the Seven-Question Study
The study design is where the intellectual work happens. A poorly designed study will produce plausible-sounding nonsense - which is worse than producing nothing at all, because it will be acted upon with confidence. The seven questions below have been refined through dozens of studies and are designed to cover the full arc of a B2B purchase decision, from initial evaluation through post-purchase reflection.
Each question maps to a specific component of win/loss intelligence. Together, they produce a complete picture of how the market evaluates your product against alternatives.
Question 1: Evaluation Process Mapping
"You are evaluating solutions in [category] for your team. Walk me through your evaluation process. What do you look at first? Who else gets involved?"
This question establishes how your buyers actually buy - not how your sales team assumes they buy. The gap between these two things is often enormous. You may discover that your target buyers start with peer recommendations rather than Google searches, that procurement has veto power you did not account for, or that the "decision maker" your reps are targeting is actually the third person consulted, not the first.
The evaluation process question also reveals which touchpoints matter most. If eight out of ten personas mention checking G2 reviews before visiting your website, your investment in review management just became significantly more urgent than your homepage redesign.
Question 2: Head-to-Head Decision Drivers
"You have narrowed it down to [Product A] and [Product B]. Product A offers [your value propositions]. Product B offers [competitor value propositions]. Which way are you leaning and why?"
This is the core of win/loss analysis: the direct comparison. By presenting specific value propositions for each product, you force the persona to make a choice and articulate the reasoning. The responses reveal which of your value propositions actually resonate in a competitive context - which is meaningfully different from how they perform in isolation.
A common finding is that features your team considers differentiating are perceived by buyers as table stakes. Equally common is the discovery that something you barely mention - an integration, a deployment model, a certification - is the deciding factor for a significant segment.
Question 3: Sales Experience Impact
"The salesperson for Product A was [description of your sales experience]. The salesperson for Product B was [description of their sales experience]. How much does the sales experience matter to your decision?"
Sales experience is the dark matter of win/loss analysis. It is omnipresent, gravitationally significant, and almost entirely invisible in traditional research because nobody wants to tell your VP of Sales that their team was the reason you lost the deal.
Synthetic personas have no such compunction. If an aggressive sales cadence alienated the buyer, they will say so. If the competitor's rep was more consultative, more technically fluent, or simply more pleasant to deal with, that will surface. The data from this question frequently produces the most actionable insights in the entire study - and the most uncomfortable ones.
Question 4: Price-Value Assessment
"Product A costs [your price] and Product B costs [competitor price]. At those prices, which feels like better value? What would change your mind?"
Note the phrasing: "better value," not "cheaper." This question measures perceived value relative to price, which is a fundamentally different thing from price sensitivity. A product can be more expensive and still feel like better value if the buyer believes it will deliver disproportionate return.
The "what would change your mind" follow-up is critical. It reveals the specific conditions under which price becomes the deciding factor versus a secondary consideration. For some segments, no price difference will overcome a feature gap. For others, a 15% premium is the threshold at which they switch. This granularity is what makes the question useful rather than merely interesting.
Question 5: Post-Decision Regret and Switching
"You chose Product B. Six months later, you are having [common competitor problem]. How do you feel? Would you switch? What would it take?"
This question simulates buyer's remorse - one of the most valuable and least-studied phenomena in B2B sales. By placing the persona in a scenario where their chosen product has disappointed them, you discover the conditions under which competitors' customers become available.
The practical output is a switching opportunity map: specific triggers, timelines, and conditions that create openings for win-back conversations. If seven out of ten personas say they would reconsider after experiencing poor customer support, your competitive strategy just acquired a concrete trigger to monitor and exploit.
Question 6: Win-Back Intelligence
"What ONE thing could Product A have done differently to win your business?"
The constraint of "one thing" is deliberate. When asked for general feedback, personas (like humans) produce diffuse lists. When forced to choose a single factor, they reveal priorities. The aggregated responses to this question typically cluster around two or three themes - and those themes form the foundation of your win-back playbook.
Question 7: Peer Recommendation Dynamics
"If a friend asked you 'should I go with Product A or Product B?', what would you tell them honestly?"
The peer recommendation question captures something that no other question does: the unvarnished, off-the-record assessment. People say different things to friends than they say to vendors. The informal recommendation reveals the narrative that exists in the market about your product versus competitors - the watercooler version, not the procurement-committee version.
This question also produces excellent quotable material for competitive battlecards. If a synthetic buyer says "go with Product B unless you need [specific feature], in which case Product A is the only real option," you have just identified your competitive wedge in the market's own language.
The Five Deliverables
A well-executed win/loss study produces five distinct outputs, each serving a different audience within the organisation. Claude Code generates all five from a single completed study.
1. Win/Loss Theme Report
The foundational document. It synthesises all seven questions into a narrative that identifies the top three to five reasons deals are won and the top three to five reasons they are lost. Each theme is supported by direct quotes from the synthetic personas and quantified by the proportion of respondents who cited it.
The theme report is the document your executive team reads. It should be concise - two to three pages at most - and brutally honest. If the primary reason for losses is "your product is more expensive and buyers do not perceive sufficient value to justify the premium," say that plainly. Euphemism is the enemy of action.
2. Sales Experience Scorecard
A structured assessment of how the sales process affects win rates. This scorecard breaks the sales experience into component parts - responsiveness, technical depth, consultative approach, follow-up cadence, demo quality - and rates each on the basis of persona feedback.
The sales experience scorecard is the document your VP of Sales reads, ideally without defensiveness. It identifies specific, coachable behaviours that are helping or hurting close rates. "Reduce follow-up frequency from daily to twice-weekly" is more useful than "improve the sales experience."
3. Price Sensitivity by Value Segment
A matrix that maps price sensitivity against perceived value across different buyer segments. This reveals where you have pricing power (segments that perceive high value and are less price-sensitive) and where you are vulnerable (segments that perceive low differentiation and will switch for a 10% discount).
This deliverable feeds directly into pricing strategy and discount policy. If enterprise buyers are price-insensitive but mid-market buyers are not, your pricing tiers should reflect that asymmetry. If you have been offering the same discount structure to both, you have been leaving money on the table with one segment and losing deals unnecessarily with the other.
4. Switching Opportunity Map
A visual representation of when and why competitors' customers become available for acquisition. The map identifies specific triggers (product failures, price increases, contract renewals, leadership changes) and timelines (immediate, 3-6 months, 12+ months) that create switching windows.
Sales teams use this map to time their outreach. If the data shows that competitors' customers are most receptive to switching 60-90 days before contract renewal, your outbound sequences should be calibrated accordingly. If poor customer support is the primary trigger, monitoring review sites for negative competitor reviews becomes a lead-generation activity.
5. Win-Back Playbook
A tactical document that translates the study findings into specific actions for recapturing lost deals and acquiring competitors' dissatisfied customers. The playbook includes messaging templates (drawn from the language the personas used), objection-handling frameworks (addressing the specific concerns that caused losses), and timing recommendations (based on the switching opportunity map).
The win-back playbook is the document your sales development team reads. It should be immediately actionable - not strategic, not philosophical, but "here is what to say to a prospect who chose Competitor X three months ago and is now experiencing Y problem."
The Practical Workflow
Running a synthetic win/loss study with Claude Code and FishDog takes approximately 15-20 minutes of active work, followed by 10-15 minutes of automated processing. Here is the workflow, step by step.
Step 1: Install the FishDog Skill
If you have not already installed the FishDog research skill for Claude Code, do so first:
``` npx skills add Ask-FishDog/fishdog-product-research-skill ```
This gives Claude Code the ability to interact with the FishDog API directly - creating research groups, designing studies, asking questions, and extracting insights without leaving your terminal.
Step 2: Create the Research Group
Tell Claude Code to create a research group that matches your buyer profile. Be specific about demographics, job titles, company size, and industry. The more precise the group, the more relevant the responses.
For example: "Create a research group of 10 personas. They should be senior technology buyers - VPs of Engineering, CTOs, and Heads of IT - at mid-market SaaS companies with 200-1,000 employees in the United States. They are evaluating project management tools."
Claude Code will call the FishDog API to recruit personas matching these criteria. This typically takes 30-60 seconds.
Step 3: Create the Study
Instruct Claude Code to create a win/loss study using the research group. Provide the study objective and the competitive context:
"Create a win/loss study for Acme PM versus Competitor X. Our value propositions are: native Jira integration, unlimited projects on all plans, and SOC 2 compliance. Their value propositions are: better mobile experience, lower starting price, and built-in time tracking. We price at $15 per user per month. They price at $10 per user per month."
Claude Code will create the study, design the seven questions using the framework above, and submit them to the research group.
Step 4: Wait for Responses
FishDog's personas respond asynchronously. Claude Code polls the API at intervals until all responses are collected. This typically takes 5-10 minutes for a 10-persona study with seven questions. You can continue other work in a separate terminal while this runs.
Step 5: Complete the Study
Once all responses are in, Claude Code triggers the study completion, which generates FishDog's AI-synthesised insights - a summary of patterns, themes, and notable findings across all responses.
Step 6: Extract the Deliverables
This is where Claude Code earns its keep. Instruct it to generate the five deliverables listed above, and it will analyse the raw responses, cross-reference them against the completion insights, and produce structured documents ready for distribution.
The entire process - from "run a win/loss study" to "here are five deliverables for five different stakeholders" - takes under 30 minutes. A traditional win/loss programme producing equivalent coverage would require 8-12 weeks and $15,000-$30,000 in consulting fees.
How This Connects to the Broader PMM Toolkit
Win/loss analysis does not exist in isolation. It feeds and is fed by nearly every other product marketing function.
The evaluation process data from Question 1 informs your positioning strategy. If buyers consistently describe your product as "the enterprise option" when you are positioning as "the agile alternative," your positioning has a credibility problem that no amount of messaging refinement will solve. Positioning must be grounded in how the market actually perceives you, not how you wish to be perceived.
The head-to-head comparison data from Question 2 feeds directly into competitive battlecards. The language your synthetic buyers use to describe the competitive choice - their metaphors, their priorities, their dismissals - is precisely the language your sales team should use in competitive situations. Battlecards built from win/loss data are materially more effective than battlecards built from feature matrices, because they reflect the buyer's frame of reference rather than the product team's.
The price-value assessment from Question 4 complements dedicated pricing research. Win/loss pricing data reveals how price functions in a competitive context - which is different from how it functions in abstract willingness-to-pay surveys. A buyer who says "$15 per user per month is fair" in a pricing study may say "$15 per user per month is too much when Competitor X charges $10 and the difference does not justify the premium" in a win/loss study. Both data points are valid. Together, they are substantially more useful than either alone.
The peer recommendation dynamics from Question 7 feed your content marketing and advocacy programmes. If synthetic buyers consistently recommend your product for a specific use case or buyer profile, that is the niche to own in your content strategy. If they recommend the competitor for a different niche, that is the territory to either contest or concede.
When to Run Synthetic Win/Loss (and When Not To)
Synthetic win/loss analysis is most valuable in three scenarios.
First, as a baseline before launching a traditional programme. If you are about to invest in a formal win/loss programme with buyer interviews, running a synthetic study first gives you hypotheses to test and themes to probe. Walking into a buyer interview with "our synthetic research suggests that sales follow-up cadence is a significant factor in deal outcomes - does that match your experience?" produces better conversations than walking in with a blank notepad.
Second, as a supplement to fill the gaps. Even the best traditional win/loss programmes cover a minority of deals. Synthetic analysis can cover the scenarios you cannot interview for: the deals where the buyer will not take your call, the competitive matchups you rarely encounter, the market segments you are considering entering but have not yet sold to.
Third, as a rapid diagnostic when something changes. A new competitor launches. Your close rate drops by 20% in a quarter. A major feature ships and win rates do not improve as expected. In these situations, waiting 8-12 weeks for traditional win/loss data is untenable. A synthetic study in 30 minutes gives you directional intelligence to act on while the slower data catches up.
Synthetic win/loss is less appropriate when you need to understand account-specific dynamics (why did we lose the Accenture deal specifically?), when relationship factors dominate the decision (government procurement, highly regulated industries), or when the buying process is so unusual that standard personas cannot simulate it meaningfully. In these cases, there is no substitute for picking up the phone.
A Note on Honesty
There is a temptation, when designing win/loss studies, to frame the questions in a way that flatters your product. Resist it. The entire value of win/loss analysis - synthetic or otherwise - lies in its willingness to deliver uncomfortable truths. If you design a study that leads the personas toward favourable conclusions, you will get favourable conclusions, and they will be worthless.
The best win/loss studies are the ones where the product team reads the results and winces slightly. Not because the news is catastrophic, but because it challenges an assumption they had been comfortable with. Perhaps the feature they shipped last quarter is not the differentiator they believed it to be. Perhaps the competitor they dismissed is more respected in the market than they assumed. Perhaps the pricing they fought for internally is, in fact, the primary reason deals are walking out the door.
These are the insights that change outcomes. And they are available, reliably and at scale, to any team willing to ask the questions honestly and read the answers without flinching.
Getting Started
The barrier to entry is deliberately low. Install the FishDog skill for Claude Code, describe your competitive scenario, and ask for a win/loss study. The seven-question framework, the five deliverables, the competitive context - Claude Code handles all of it. Your job is to provide the inputs (who are your buyers, what do you sell, who do you compete with) and to act on the outputs.
If you have never conducted win/loss analysis before, a synthetic study is the ideal starting point. You will learn more about your competitive position in 30 minutes than most companies learn in a quarter. If you already run a traditional programme, a synthetic layer will double your coverage and halve your blind spots.
Either way, the days of relying on a handful of polite phone calls with buyers who have every reason to be diplomatic are, mercifully, numbered.
The full FishDog platform, including the API that powers the Claude Code integration, is available at fish.dog.
This article is part of the "How To" series on using Claude Code and FishDog for product marketing research. Other guides in the series cover [positioning validation](https://fish.dog/news/how-to-validate-product-positioning-with-claude-code-and-fishdog), [competitive battlecards](https://fish.dog/news/how-to-build-competitive-battlecards-with-claude-code-and-fishdog), pricing research, product messaging, voice of customer, customer segmentation, GTM strategy, content marketing, sales enablement, and product launch research. The guides are written for Claude Code. These articles are written for you.