
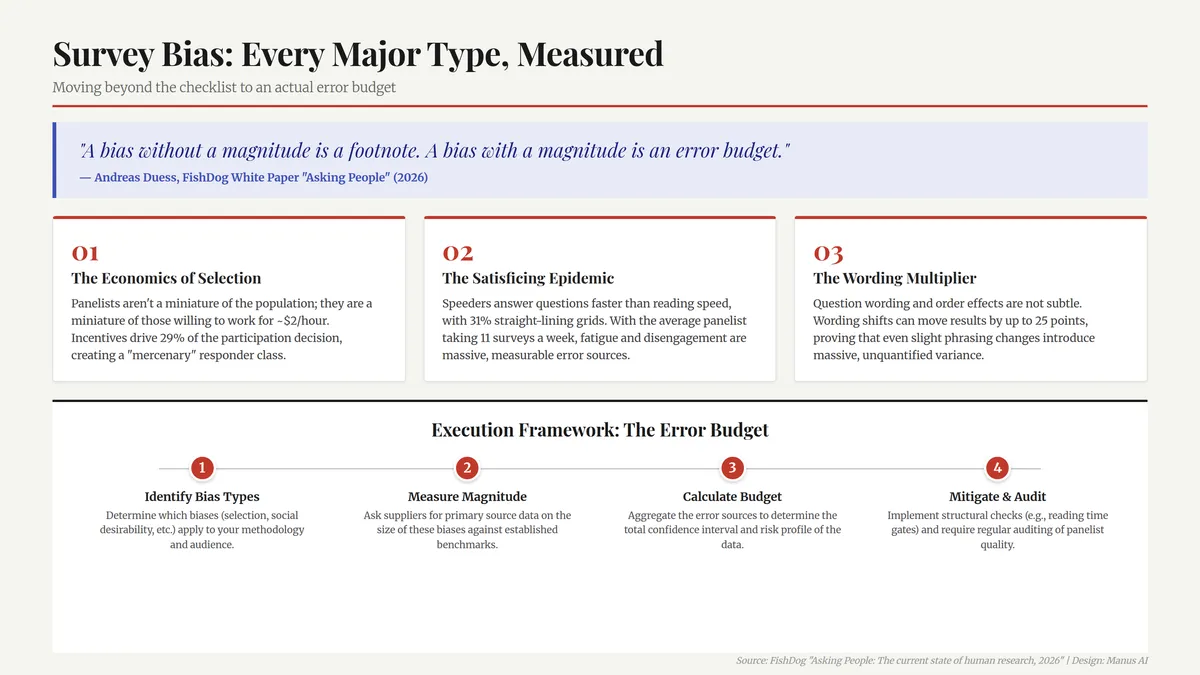
Search for survey bias and you get taxonomies. Selection bias, response bias, social desirability bias, the same list on a hundred research-vendor blogs, each type defined in a sentence and closed with advice to "craft neutral questions."
What the lists almost never include is a number. Which is odd, because the numbers exist. Survey methodology is one of the best-instrumented fields in social science, and the major biases have been measured, some of them for forty years. A bias without a magnitude is a footnote. A bias with a magnitude is an error budget.
We compiled the measured record for our white paper, Asking People: The current state of human research. This article is the bias taxonomy from that work, with the magnitudes attached. Every figure comes from a primary source, cited in the paper.
Selection bias and self-selection bias: who joins a panel
Selection bias enters before a single question is asked, through who puts themselves forward.
Start with the economics. A 2018 ACM study that instrumented 2,676 crowdworkers across 3.8 million tasks found median earnings of about $2 an hour, with 4 percent of workers clearing the US federal minimum wage. Consumer panels test out in the same range. A panel recruited at that rate is not a miniature of the population. It is a miniature of the people who will answer questions for two dollars an hour.
The motivation research backs this up. Brosnan, Kemperman, and Dolnicar found the incentive accounts for 29 percent of the decision to take a survey, with speed of completion second at 14 percent. They classify 15 percent of panel members as "mercenary responders," in it primarily for the payment. And this is not a fringe population: CivicScience measured 14 percent of US adults as current paid survey panellists, with panellists measurably more brand-aware and more financially optimistic than non-panellists.
Self-selection bias is the same mechanism viewed from the respondent's side: nobody is sampled into an opt-in panel. They arrive. Whatever made them arrive travels with every answer they give.
Sampling bias and non-response bias: who never answers
Sampling bias is a frame problem: the pool you draw from does not match the population you want to describe. Non-response bias is its quiet partner: even from a good frame, the people who answer differ from the people who do not.
The scale of the non-response problem is the least appreciated number in research. Pew Research Center's telephone surveys had a 36 percent response rate in 1997 and 6 percent by 2018. Pew's probability-based online panel reports a 92 percent response rate per wave, and a 3 percent cumulative response rate once recruitment refusals and attrition are counted. The 97 percent who never enter the path are not a random subset of the population, and no weighting scheme fully repairs that.
The downstream cost is measured. In Pew's 2023 benchmarking study, opt-in samples averaged 5.8 percentage points of error against 28 government benchmarks; probability panels averaged 2.6. For adults under 30, opt-in error rose to 11.2 points. In one opt-in poll, 12 percent of respondents under 30 claimed to hold a licence to operate a nuclear submarine, and 20 percent agreed the Holocaust is a myth, against 3 percent on the probability panel. Same questions, different recruitment path, different world.
Social desirability bias: the say-do gap
Social desirability bias is the tendency to give the answer that looks good rather than the answer that is true. It is best measured where stated values meet actual behaviour.
The cleanest example is sustainability. In research published in Harvard Business Review: 65 percent of consumers said they want to buy from purpose-driven brands that advocate sustainability. About 26 percent did. Purchase-intent research generally predicts sales only under narrow conditions, and worst exactly where research budgets concentrate, on new products over long horizons.
Group settings amplify the effect. A 2022 review in Revista de Saude Publica describes focus groups forming a "social micro-pact" to collectively hide behaviours the group considers inappropriate, with peer presence intensifying the pressure toward acceptable answers. Interviewer bias belongs to the same family: the documented acquiescence effect strengthens when an interviewer is present, and a moderator's conduct can amplify social desirability rather than defuse it. Recall bias compounds all of it, because even a willing, honest respondent is reconstructing behaviour from memory, not reporting it from records.
Leading questions and biased survey questions
The instrument itself moves the answer, and this is the best-measured bias of all. Pew publishes its own question-design experiments, fielded to randomly assigned groups, so the difference is attributable to the question rather than the people.
In January 2003, 68 percent of Americans favoured "taking military action in Iraq to end Saddam Hussein's rule." Add "even if it meant that U.S. forces might suffer thousands of casualties" and 43 percent favoured the same action. Twenty-five points from one subordinate clause. In 2008, 58 percent named the economy as the most important issue when it appeared in a list; 35 percent named it when the question was open-ended. In 2005, "the means to end their lives" drew 51 percent support; "assist terminally ill patients in committing suicide" drew 44 for the same act.
The pattern is not anecdotal. Schuman and Presser established it across more than 200 experiments in 34 surveys, published in 1981. Anyone writing biased survey questions today, deliberately or not, is operating well-documented machinery.
Question order bias and acquiescence bias
Order effects are smaller than wording effects but move results all the same. Americans' dissatisfaction with the country's direction ran 10 points higher when the question followed a presidential approval question. Support for legal agreements for same-sex couples ran 8 points higher when it followed a question about marriage. Response order matters too: visual lists produce primacy effects, read-aloud lists produce recency effects, and primacy grows as lists get longer.
Acquiescence bias is the tendency to agree with whatever statement is put in front of you. Pew's methodology work shows it concentrates among less educated and less informed respondents and intensifies when an interviewer is present. Malhotra showed in 2008 that the fastest respondents are the most vulnerable to response-order effects, which connects instrument bias to the final category.
Satisficing: the bias of not really answering
Satisficing is giving a good-enough answer instead of a considered one, and it has been measured directly. In a probability-based Dutch panel, respondents answered a mean of 15 out of 54 questions faster than they could plausibly have read them. On grid questions, 31 percent of those speeders straight-lined, against under 1 percent of other respondents. Longer-tenured panellists sped more, not less.
The volume explains it. The average online panellist takes nearly 11 surveys a week; one in five takes more than 25. Survey fatigue at that scale is not an occasional failure of attention. It is the standing condition under which the answers are produced.
Survey bias is an error budget, not a scandal
None of this makes surveys worthless. Every measurement instrument carries error; the disciplines that use instruments well are the ones that state the error instead of rounding it to zero. What the record argues against is treating any single survey result as a fact rather than a reading, produced by a specific recruitment path, through a specific questionnaire, at a specific moment.
The practical move is to ask for magnitudes. Which of these biases did the supplier measure? What is the cumulative response rate, not the wave rate? Was the wording tested experimentally? What share of completes was removed for speeding or straight-lining? And where has the method, any method, been benchmarked against an outcome that actually happened?
I made the fuller version of that argument in Human Research Is a Measurement, Not a Baseline. The sources for every number in this article are in the white paper: Asking People: The current state of human research.