Executive summary
The primary-research inputs organizations rely on are getting noisier, slower, and more expensive. Response rates have collapsed, a meaningful share of online panel respondents are fraudulent or inattentive, and the checks meant to catch them miss most of them. Specialist interviews remain valuable but are expensive, slow to schedule, and hard to scale.
Human research remains valuable, but the "real human" baseline is no longer a clean benchmark. The buyer's real question is not whether synthetic research can replace human judgment. It is whether a synthetic method can deliver a fast, inspectable signal with known failure modes.
FishDog in one page
| What it is | A digital twin of the US population. FishDog builds a calibrated synthetic population first, then recruits research panels from it. You pose the question you would normally field to a survey, panel, focus group, or specialist interview; FishDog recruits the right people from the population, asks them at scale, and returns the answer with the reasoning behind it. |
|---|---|
| What it is not | Not a generic LLM or chatbot, not an "LLM wrapper," not a set of hand-written personas, and not a replacement for the researcher's judgment. It holds no private facts about real, named people or companies. |
| Why it matters | The inputs to primary research are degrading: panels self-select, fraud is common and hard to detect, and fielding costs rise while the time available to decide shrinks. |
| How it fits the workflow | A leading indicator and complement, not a substitute. Before commissioning expensive primary research, between tracking waves, on any micro-cohort on demand, and after a news shift, when the same panel can be re-run the same day. |
| How value is measured | Speed to signal, cost against surveys, panels and interviews, quality of hypothesis generation, repeatability of a pinned re-run, breadth of evidence, and usefulness in decision-making. |
| How it is trusted | A calibrated population benchmarked against external yardsticks, with version control, disclosed panel composition, and stated limitations on every study. |
FishDog builds a statistically valid representation of a population, calibrated from the most recent United States Census and ACS Public Use Microdata and enriched against more than 40 additional data sources. Each person carries a role, a location, current news, local conditions, and a five-factor (OCEAN) personality that shapes how they interpret information and respond.
Panels recruited from that population can be interviewed in depth, re-cut into cohorts on demand, re-run when the news changes, and benchmarked against external yardsticks including real-money prediction markets, Gallup and Pew, and the University of Michigan consumer-sentiment series.
Methodology at a glance
| Population frame | US Census and American Community Survey (ACS/PUMS) microdata, calibrated to ~1% average marginal error on selected marginals; enriched with more than 40 role, location, news, local-condition, and personality inputs. |
|---|---|
| Currency | Each person reasons from a live feed of more than 350 news sources, collected and summarised hourly, with their personalised selection updated daily, rather than from a static base-model snapshot. |
| Validation | Layered and continuous: prediction markets across 18 event axes (daily), Gallup and Pew (~9% marginal error), and the University of Michigan consumer-sentiment series. |
| Cadence | Cohorts recruited and fielded on demand; benchmarks scored daily; a panel can be re-run the same day after a news event. |
| Disclosure standard | Every study reports panel composition, observed versus inferred attributes, run date, and model, prompt, population, and source versions. |
Key points
- Recruit, do not create. Drawing from a calibrated population removes the largest source of hand-selection bias. The validation stack then measures the model, construction, and prompt biases that remain.
- A layered validation stack rather than a single accuracy number. The population is checked against census marginals before any question is asked, then benchmarked against real-money prediction markets, Gallup and Pew, and the University of Michigan series.
- A reliability estimate before the event resolves. Because every benchmark question is scored on the same 18 prediction-market axes, a new question can be matched to earlier questions of the same shape, giving an expected reliability range while there is still time to act.
- Known limitations. The literature documents that synthetic respondents can flatten variance, react to prompt wording, and drift across model versions. Section 5 sets out each one and what FishDog does about it.
- Speed, cost, and re-cuttability. Any cohort, fielded today, interviewed in depth, and re-run after a news event, at a fraction of the cost and time of a human panel.
This paper sets out how the population is built, how panels are recruited from it, how each person is given context, how outputs are tested, and where the method is weak. The intended readers are research, data-science, and methodology reviewers who will inspect the assumptions. FishDog supports work across consumer and market research, product and concept testing, media and audience testing, policy and public affairs, healthcare, and B2B.
1. The problem: primary-research inputs are degrading
Most conversations about synthetic research start from a faulty premise: that human research is ground truth and everything else must be graded against it. That premise no longer holds. FishDog's evidence review of survey research sets out the record in detail (Duess, 2026); the main findings are below.
Fewer people answer
Pew Research Center's telephone response rates fell from 36 percent in 1997 to 6 percent in 2018 (Kennedy & Hartig, 2019). Paid online panels fill the gap, and they self-select toward people who place a low value on their time, which skews the sample away from the population the research is meant to represent.
Many who answer are not who they claim to be
A 2026 NORC literature review places typical fraud in non-probability online samples at 15 to 30 percent (NORC at the University of Chicago, 2026). Of the respondents Pew identified as bogus, 84 percent passed an attention-check question and 87 percent passed a speeding check (Kennedy et al., 2020). An autonomous AI respondent documented in 2025 passed 99.8 percent of attention checks at a cost of about five cents per completed interview (Westwood, 2025). The "human" panel may already contain machines.
The error is measurable
Opt-in online samples average 5.8 percentage points of error against government benchmarks, against 2.6 for probability panels (Mercer & Lau, 2023). Add social-desirability bias, acquiescence, and panel conditioning, and the baseline looks less like ground truth and more like a noisy, biased instrument that happens to be made of people.
Specialist interviews have their own limits
For questions that need expertise, research teams turn to expert networks and specialist interviews. These are deep but expensive, slow to schedule, and drawn from the same rosters, so views converge as more buyers hear them. Verifying that a paid participant has the expertise they claim is getting harder as AI tools reach every call.
Properly governed human research remains valuable, but the comparison a buyer wants to make, synthetic versus "real," is against a baseline that is itself broken in specific, documented ways.
A synthetic population built by construction does not self-select, cannot be coached to defraud a screener, and does not try to tell the interviewer what it thinks the interviewer wants to hear. It has its own failure modes, addressed in Section 5, but they are different failure modes, and they can be measured and corrected.
Exhibit 1. Where the two incumbent primary-research inputs break down.
| Failure mode | Specialist interviews | Survey panels |
|---|---|---|
| Roster / sample formation | The same specialists are reused across buyers, so views converge as more buyers hear them. | Respondents self-select into paid panels, often because their time is cheap enough to make low-paid participation worthwhile. |
| Screening integrity | Non-specialists can qualify for calls and use AI tools during interviews, making expertise harder to verify. | Fraud and coached personas make it hard to know whether respondents are who they claim to be, and standard checks miss most of them. |
| Signal quality | A strong interview can be deep, but the output depends on one person's recall, incentives, and willingness to speak plainly. | Panels provide breadth, but responses are shallow, self-reported, and exposed to social-desirability bias, acquiescence, and panel conditioning. |
| Speed and cost | Scheduling, screening, and premium hourly rates create lag and cost. | Lower cost per respondent, but quality control, re-fielding, and fraud management add friction. |
| Follow-up / re-cutting | Follow-up is rich but requires more calls, more scheduling, and more budget. | Cohorts are fixed once fielded; new cuts or follow-up questions often require another wave. |
Source: FishDog analysis, drawing on the survey-methodology literature reviewed in Duess (2026) and Section 5.
2. What FishDog is
FishDog builds, enriches, and validates a calibrated synthetic population: a digital twin of the US population that research panels are recruited from on demand. The same population serves consumer, media, healthcare, policy, and B2B research.
A researcher poses the kind of question they would normally take to a survey, a panel, or a specialist interview. FishDog recruits the relevant people from its calibrated population, asks them at scale, and returns both the answer and the reasoning behind it.
Recruit, do not create
The common way to build synthetic respondents is to write personas: describe a few archetypes and prompt a model to speak as them. That approach imports two biases at once, the author's idea of who the customer is and the model's tendency to tell a tidy story.
FishDog inverts the order. It builds a statistically valid representation of an entire population first, calibrated to real demographic distributions, and then recruits a panel from it the way a research firm recruits from the real world.
Recruitment from a calibrated population still leaves some bias in the system, inherited from the language model's training data. What it removes is the largest single source, hand-selection bias, and it makes what remains auditable. Every person in a panel is the output of a method that starts from a defensible population frame and is tested continuously against external benchmarks.
Because recruitment starts from a population rather than a hand-written persona, FishDog can reach the people a research team often finds hardest to recruit: the warehouse manager who runs cold-chain logistics for a national restaurant account, or the oncology nurse coordinating infusion care in a regional cancer clinic. Hard-to-reach groups are where human recruitment is thinnest and most expensive, and where a recruited synthetic population has the most to add.
The prediction-market benchmarks in Section 4 show the same pattern: questions that turn on technical and domain knowledge score better than low-information questions. FishDog is most useful where the knowledge barrier is high.
Three properties follow from the design and distinguish it from a human panel:
- On-demand cohorts. A fixed survey is fixed at fielding. FishDog can build and probe cohorts such as chief information officers at firms of 250 to 500 employees in a named vertical, without recruiting them one by one.
- Interrogation over one-shot capture. Each person in a panel can be asked follow-up and "why" questions individually and at volume, surfacing the reasoning behind a number. A fixed-form survey cannot do this without re-fielding.
- No fatigue, no attrition, no recruitment lag. Repeated waves do not burn the panel. Consistency over time is controlled through software, versioning, and validation rather than re-recruited for each wave.
There is also a structural privacy advantage. A synthetic respondent is not a real person, so a study carries none of the consent, personal-data, or re-identification exposure of human fieldwork. The hard boundary is the same in every domain: FishDog is not a source of private facts about real, named individuals or companies, because it has none.
FishDog sits alongside the incumbents as a faster, cheaper complement and leading indicator to human research, with its credibility resting on the validation in Section 4. The same population powers FishDog's applications, including TestScreen, which runs test screenings for film, television, and advertising.
Exhibit 2. Create-a-persona versus recruit-from-a-population.
| Create a persona | Recruit from a population |
|---|---|
| Start with an archetype the author imagines: "a CIO," "a soccer dad," "a rural patient." | Start with a calibrated population built from Census, ACS/PUMS, and additional role, location, news, and personality inputs. |
| The researcher or prompt writer decides who exists before the research begins. | The population defines who can be recruited; the researcher specifies the question and the eligibility criteria. |
| The model is asked to role-play the archetype. | FishDog recruits matching people from the population, each with role-specific public context. |
| Bias enters through persona design and the model's tendency to produce a tidy, average answer. | Bias is constrained by the population frame, source versioning, and external validation. Remaining bias is measured rather than assumed away. |
| Outputs are difficult to audit because the respondent was invented for the prompt. | Outputs can be traced to a population frame, cohort definition, source bundle, model version, and benchmark history. |
Source: FishDog methodology.
3. How the population is built and calibrated
The build follows a fixed order: construct the population, recruit and enrich the panel, add role-specific context, give each person texture and memory, and keep them current.
Population construction
The population is calibrated against the most recent United States Census and the American Community Survey Public Use Microdata Sample, which provides individual record-level microdata across occupation, health, income, and dozens of other attributes. FishDog builds calibration targets from PUMS and aligns the synthetic population to them, achieving a distributional fit of roughly 1 percent marginal error on average against selected census-frame marginals.
The method is standard survey and population-synthesis practice. Iterative proportional fitting, also called raking, adjusts a table until its totals match known marginals (Deming & Stephan, 1940), and post-stratification and raking to population marginals are what national pollsters use (Little, 1993; Pew Research Center, 2018). Building a synthetic population by fitting census microdata to census marginal tables has been standard in transportation and urban modeling since the 1990s (Beckman, Baggerly & McKay, 1996), with combinatorial methods developed for small areas (Williamson, Birkin & Rees, 1998). For scale: the American Community Survey reports margins at the 90 percent confidence level, and a national poll of 1,000 people runs to roughly plus or minus three points.
A note on scope
This paper describes the United States population, because the public ground-truth instruments used in validation, the Census, Gallup and Pew, and the University of Michigan series, are richest and longest-running in the US, which makes it the most demanding place to show the method.
The same construction approach is being applied to other markets, calibrated to each market's own authoritative demographic sources rather than to US benchmarks. Validation in each market is anchored to the instruments available there, so the depth of external benchmarking varies with how much public ground truth a country publishes.
From population member to panel member
A census-calibrated population member becomes a useful research participant by separating four things: what is directly grounded in data, what is modeled from that data, what public information the person is allowed to use, and how they are required to answer.
- Observed and calibrated attributes. Attributes grounded directly in the census and ACS/PUMS frame, such as age, geography, education, household structure, income, occupation class, and selected health and labor-market variables.
- Inferred and enriched attributes. Attributes that are plausible given the observed frame but not directly present in the census microdata, such as role seniority, budget authority, firm-size band, procurement exposure, or whether a worker in a given occupation is likely to deal with a specific category of vendor. These are generated under constraints and audited for distributional reasonableness. They are modeled enrichment, not observed facts taken from specific people.
- Role-specific source context. Once a person is recruited, the system gives them the public information their real-world counterpart would plausibly consume: trade publications, public filings, relevant news, regional conditions, domain literature, and other sources.
- Question-time constraints. At answer time, each person is instructed to distinguish what they know from public information, what they infer from role experience, and what they cannot know. That constraint matters most for company-specific questions, where FishDog can provide structured inference but not private disclosure.
Each layer does one job:
- Census calibration sets the population frame.
- Enrichment makes that frame useful for recruiting specific roles.
- Role-specific source context gives each recruited person current information to reason from.
- Validation checks whether the resulting signal tracks the outside world.
Recruitment and role-specific context
Every person shares a common baseline: demographics flow to occupation, income, and skills, which flow to health, which flows to the information that person would plausibly consume. Specialists then receive role-specific public material. An AI professor and an oncology nurse start from the same construction and diverge through the sources each is given. No one is inherently "more powerful" than another; the difference is the context each has available.
FishDog keeps this source grounding separate from fine-tuning. Source grounding adds or updates public material and is reversible. Fine-tuning changes the model weights, and FishDog describes it as such when it is used.
Texture and personality
Each person is given texture so their answers read as messily human rather than uniform. Each consumes role-appropriate and location-appropriate news and weather, and each carries a personality grounded in the five-factor (OCEAN) model. The trait scores are synthetic: they are generated, adjusted for demographic and occupational characteristics, and calibrated against published population-level Big Five research (Soto & John, 2017). They are not observed personality measurements of individual people. The five-factor model is the field's consensus descriptive taxonomy of personality (John & Srivastava, 1999; Goldberg, 1990; McCrae & Costa, 1987).
FishDog extends that five-dimension foundation with additional modeled dimensions. The additional dimensionality is a FishDog design choice; the academic literature validates the five-factor foundation.
Memory
Memory is separated into two layers so that client work cannot contaminate the population.
Persistent memory holds each person's stable profile and external context: character, macro conditions, news, weather, and health. It changes only when outside conditions change. An oil-price shock can affect a person in an energy-exposed role; a client's line of questioning cannot.
Episodic memory belongs to a study. Client interactions are logged for the client's own use, but they are not fed back into the population.
Staying current
Base language models are trained on a static snapshot of the world, and the lag varies by model and vendor. FishDog closes that gap with a live feed of more than 350 news sources. News is collected and summarised hourly, and each person's personalised selection is updated daily, so people reason from current information rather than a stale snapshot. For specialist briefs, the feed can supply domain literature, for example research articles for a clinical panel, in place of general news.
The feed is matched by profile. A person's likely sources and topics come from their location, occupation, interests and wider profile, and stories are ranked by geographic plausibility, source and topic fit, story importance and diversity. Political context and values contribute indirectly. A separate industry briefing keyed to each person's occupation is refreshed weekly. As a result, two people exposed to the same event cycle can receive different information environments. Source mixes are versioned and audited. The system does not inject a conclusion or a preferred answer. It supplies the context a person in that role would encounter and lets them reason from it. That is the working difference between this and a generic prompt to "act as" a customer.
What the literature supports
The research on simulating people with language models has grown quickly, and its findings point one way: simulation works when it is grounded in real population data and rich individual profiles, and fails when it leans on a label.
- Grounded simulation reproduces groups. A language model conditioned on the backstories of real survey respondents reproduces the response patterns of those subgroups, which its authors called algorithmic fidelity (Argyle et al., 2023). Models reproduce the aggregate findings of classic human-subject studies (Aher, Arriaga & Kalai, 2023). Giving models detailed life backstories brought simulated responses up to 18 percent closer to real survey distributions (Moon et al., 2024).
- Rich profiles beat labels. Agents built from the interviews and surveys of 1,052 Americans predicted those people's answers on held-out General Social Survey items at 83 to 86 percent of the people's own two-week test-retest consistency, against 74 percent for agents given demographics alone (Park et al., 2026). Demographic role-play alone did not align model and human opinions; seeding one related belief improved alignment across connected topics (Chuang et al., 2024). On climate opinion, models reproduced public views only once issue-relevant covariates were added to demographics, reaching 53 to 91 percent accuracy (Lee et al., 2024). Demographic labels on their own explain little of how people answer subjective questions (Hu & Collier, 2024).
- Simulation predicts real results. Model-simulated respondents predicted the results of 70 preregistered survey experiments with a correlation of 0.85, including studies published after the model's training cutoff (Hewitt et al., 2024). In marketing, model-generated brand perception maps closely matched maps built from human surveys (Li et al., 2024). A replication of a Fortune 500 food company's study found the model got the direction and valence of the quantitative answers right, and supplying relevant context through retrieval improved the synthetic data significantly (Arora, Chakraborty & Nishimura, 2025).
- Forecasting against live outcomes is within reach. A retrieval-augmented language-model system approached the accuracy of competitive human forecasters on questions published after its training cutoff (Halawi et al., 2024). An ensemble of 12 models was statistically indistinguishable from a crowd of 925 human forecasters (Schoenegger et al., 2024).
- Public benchmarks now exist. A representative US sample of 2,058 people answering more than 500 questions across four waves, with a repeat wave for test-retest reliability, is now available for testing simulations grounded in individual profiles (Toubia et al., 2025).
The pattern across these studies matches FishDog's design: a population built from microdata, recruitment rather than creation, rich and current individual profiles, and outputs scored against external results.
4. How it is tested, and why trust it
FishDog's validation runs in layers. It measures construction quality, benchmark fit, live forecasting, variance, and drift.
The framework is designed around the failure modes a technical reviewer would test: training-data leakage, memory contamination, distributional fidelity, prompt and model drift, variance compression, and benchmark performance over time. It answers the questions a data-science or methodology reviewer will ask:
- Does the population match known external marginals before any opinion is elicited?
- Are benchmark questions held out from product tuning where possible?
- Are outputs evaluated on distributions, not only means?
- Are prompt, model, source, and population versions pinned so a re-run is actually a re-run?
- Are training-data leakage and memory contamination structurally controlled?
- Do failure modes produce visible diagnostics rather than disappearing into a single average?
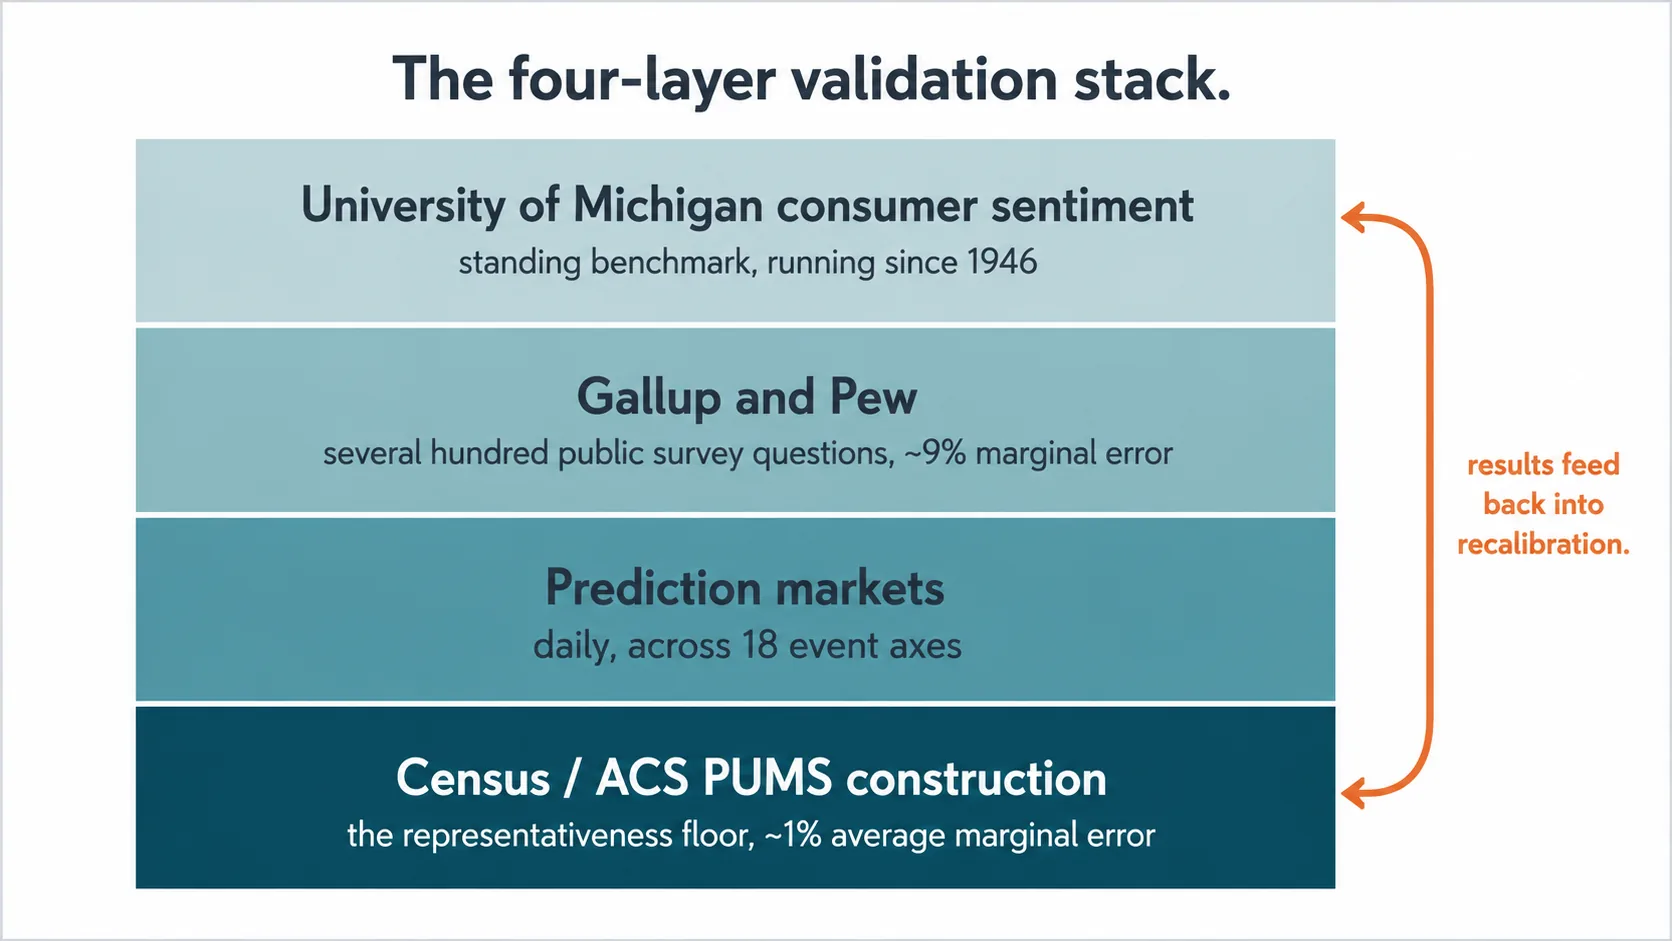
Validation dashboard
Exhibit 3. The validation stack: each layer is benchmarked against an external yardstick, with known weak spots stated alongside the result.
| Benchmark layer | Sample / period | Primary metric | Current result | Known weak spots |
|---|---|---|---|---|
| Census / ACS PUMS construction | Selected demographic and labor-force marginals | Mean absolute marginal error | ~1% average marginal error | Rare cells, sparse occupations, small geographies |
| Prediction markets | Daily benchmark across 18 event axes | Brier score, calibration error, resolution accuracy by domain | Stronger on technical and expertise-driven events, politics, and economic data | Low-information events |
| Gallup / Pew comparison | Several hundred public survey questions | Mean absolute error against published human results; variance fit where available | ~9% marginal error | Identity-shaped, highly polarized, or wording-sensitive questions |
| University of Michigan consumer sentiment | Standing benchmark against the published sentiment series | Correlation, directional accuracy, and mean absolute error against the published index | Active monitoring layer | Macro turning points, sudden shocks, recession-transition periods |
Source: FishDog validation runs against U.S. Census and ACS/PUMS, public real-money prediction markets, Gallup and Pew published results, and the University of Michigan Surveys of Consumers. The external instruments are third-party; marginal-error and accuracy figures are FishDog estimates against them.
Layer 1: the construction floor
Before any opinion is elicited, the population is audited against the real one, calibrated to Census and PUMS at roughly 1 percent marginal error across selected marginals. This layer is a representativeness check that exists independent of any single question.
Layer 2: prediction markets, daily
FishDog puts prediction-market questions to its population every day, across 18 axes. This is a signal-versus-outcome test, because a real-money market is the counterparty and the event resolves to a fact. Performance varies by domain: accuracy is strongest on technical and expertise-driven events, for example energy and product questions, and weakest on low-information events, where there is little public signal to reason from.
The 18 axes do more than grade resolved questions. Because every benchmark question is scored on the same axes, the framework builds a map of the question surface. A new question can be compared with earlier questions of the same shape, which gives reviewers an expected reliability range before the output is treated as signal. A near-term geopolitics question carries a different reliability profile from a low-information local question, and a researcher can read that profile while there is still time to act.
Unresolved questions are also how forecasting research rules out leakage. ForecastBench scores systems on 1,000 questions whose answers are unknown when the forecast is made, and on it expert human forecasters still beat the best model (Karger et al., 2025). Scoring against markets that have not yet settled applies the same discipline.
For the record of markets themselves, the paper relies on the established literature: the canonical survey of the field (Wolfers & Zitzewitz, 2004) and the long-run accuracy of the Iowa Electronic Markets, a real-money academic market that beat contemporaneous polls 74 percent of the time across 964 polls (Berg, Nelson & Rietz, 2008). Recent analyses of large commercial markets such as Polymarket are useful context but are working-paper or journalistic in status and report contested accuracy, so they are treated as context rather than core evidence.
Layer 3: Gallup and Pew
A few hundred questions drawn from established public surveys are put to the population and compared against the published human results, at roughly 9 percent marginal error. This layer benchmarks against a recognized external yardstick rather than a FishDog-defined one. Where published cross-tabs are available, FishDog compares both the aggregate answer and the distribution by demographic group.
Layer 4: University of Michigan consumer sentiment
The University of Michigan Surveys of Consumers have run since 1946 and feed the federal leading-indicator index; they are among the most scrutinized consumer-attitude measures in the world (University of Michigan, Survey Research Center). FishDog benchmarks against the same instrument as a verification layer and a standing connection to a published real-world series.
The feedback loop
These layers feed back into the system. Drift against prediction markets and against Michigan flags where adjustment is needed: weak areas get more signal through source hydration or post-training; strong areas, for example politics and economic data, are left alone. Validation is a closed loop for recalibrating against live outcomes. The operating question is whether accuracy holds over time, and the loop is designed to monitor that.
5. Known limitations
The main failure modes are below, each paired with the mitigation FishDog uses today.
- Distributional flattening and instability. The most important critique in the literature: synthetic respondents can land near the right average while showing materially less variance than real people, can be highly sensitive to prompt wording, and can drift as the underlying model updates (Bisbee et al., 2024). Layered validation and version control are designed to catch this. FishDog monitors variance against benchmark distributions, not only central tendency, and controls model and prompt versions so that a re-run is a re-run.
- Demographic misalignment. Model opinion distributions can be systematically misaligned with specific demographic groups, and steering toward a target group does not fully close the gap (Santurkar et al., 2023). Calibration reduces this; it does not eliminate it.
- Identity-group flattening. Substituting for human participants is hardest where identity shapes the response, and current training tends to flatten and sometimes mis-portray identity groups (Wang, Morgenstern & Dickerson, 2025). FishDog is most cautious, and leans hardest on validation and human triangulation, when positionality drives the answer.
- Inherited bias. Language models carry measurable political and social bias from their training data (Feng et al., 2023). For that reason FishDog benchmarks against external ground truth continuously rather than trusting the model's defaults.
- A bare model answers like no one in particular. Asked the American Community Survey with standard prompting, 43 models followed answer-order and labeling biases, and once answer order was randomized their answers trended toward uniform noise (Dominguez-Olmedo, Hardt & Mendler-Dünner, 2024). Models also generally fail to shift with question wording the way people do (Tjuatja et al., 2024). A study of opinion polls concluded that models cannot replace research subjects for attitudinal research, finding strong bias and low variance that changed unpredictably from topic to topic (Boelaert et al., 2025), and Pew's September 2026 study found large errors when a model answered surveys from demographic and attitudinal profiles (Chapekis et al., 2026). These results describe the baseline FishDog's method has to beat. They are why the population is built from microdata, why each person carries a grounded profile and current context, and why every benchmark scores distributions against external results.
- Willingness to pay is hard. Model estimates of willingness to pay were sometimes comparable to human studies but often inaccurate, and fine-tuning on past surveys helped within a category but not for new categories or for differences between segments (Brand, Israeli & Ngwe, 2023). Pricing questions on new categories need human triangulation.
- Training-data leakage. A model may have seen the data it is asked to predict, which would turn prediction into reproduction. The mitigations are structural: daily prediction-market tests run on events that postdate training, benchmark sets are versioned, and the population is calibrated to distributions rather than to memorized individuals.
- Modeled enrichment error. Moving from census member to panel member requires inferred attributes, such as role seniority or procurement exposure, that are not directly observed in PUMS. These make recruitment useful, but they are modeled variables and can be wrong. FishDog discloses sample composition and does not treat enriched attributes as facts about real people.
These mitigations reduce the problems without removing them. Human research has its own unfixed failure modes, set out in Section 1. The case for FishDog is that its flaws can be measured and corrected on a loop, and that it avoids several of the specific failures that quietly degrade the human baseline.
6. Worked example: enterprise IT budgets, SaaS versus AI versus custom builds
The example below shows the kind of decision-grade detail a recruited synthetic panel can produce, of a depth a research team would otherwise assemble over weeks of fieldwork and interviews. It is an illustrative cut, not a census of the buyer base.
Key takeaway
Enterprise software budgets are roughly flat and reallocating rather than expanding. Artificial-intelligence spend is largely cannibalizing incumbent point-solution software, not adding to it. The clearest disruption short-list is the point-solution layer, while systems of record remain durable.
Method and sample
A FishDog panel of 10 United States enterprise IT decision-makers, including chief information officers, IT and engineering leaders, and systems managers, spanning regulated environments and a conservative public-education outlier. As with any panel, the sample is disclosed and the results are not extrapolated beyond it.
Exhibit 4. Composition of the illustrative enterprise-IT decision-maker panel (n=10).
| Panelist type | Sector | Organization size band | Region | Budget authority |
|---|---|---|---|---|
| CIO | Healthcare services | 1,000-5,000 employees | South | final / shared |
| VP Engineering | B2B software | 250-500 employees | West | final |
| IT Director | Manufacturing | 1,000-5,000 employees | Midwest | recommender / shared |
| Systems Manager | Public education | 500-1,000 employees | Northeast | recommender |
| Head of Data | Financial services | 1,000-5,000 employees | Northeast | shared |
| Director, Enterprise Apps | Retail / restaurants | 5,000+ employees | South | shared |
| Security and Infrastructure Lead | Healthcare | 1,000-5,000 employees | Midwest | recommender |
| CIO | Professional services | 250-1,000 employees | West | final |
| IT Operations Lead | Logistics | 1,000-5,000 employees | South | recommender |
| Engineering Manager | Industrial technology | 250-500 employees | Midwest | recommender |
Source: FishDog synthetic panel, illustrative cut, June 2026. Figures are observed panel outputs, not extrapolated beyond the elicited responses.
What the panel surfaced
- AI's share of tooling spend grew from low single digits toward the mid-teens, with one decision-maker moving from roughly 2 percent to roughly 19 percent year over year.
- Around 60 percent of the motion was driven by top-down consolidation and return-on-investment mandates rather than bottom-up adoption.
- The build-versus-buy posture shifted from roughly 90/10 toward 80/20, a "build-lite" stance rather than a wholesale move to custom development. One case described a four-week internal build delivering roughly a 60 percent unit-cost reduction at 90 to 95 percent of the accuracy of the tool it replaced.
- The most exposed categories, named by the panel, were meeting transcription and notes, writing and grammar tools, lightweight business-intelligence overlays, simple survey and form tools, asynchronous video, and small knowledge-base chat add-ons.
- The most resilient categories were the systems of record: enterprise resource planning, customer relationship management, human-resource information systems, quality and lifecycle management, and student information systems, protected by auditability and the friction of change.
- New procurement gates appeared consistently: pilots on first-party data, "no training on customer data," data-residency and bring-your-own-key requirements, version pinning, logging and role-based access control, spend caps with token metering, and single sign-on.
Dispersion mattered
The signal was not simply "AI budgets up." The more accurate and useful read was that budgets were flat to modestly up, while the mix changed.
Representative panel language
Short excerpts make the signal more auditable than averages alone. Quotations are from synthetic panelists:
"I am not getting a bigger software budget. I am getting permission to cancel three tools if the AI workflow can cover 80% of what they did."
"Systems of record are not where we experiment. We experiment around the edges: notes, reporting overlays, internal search, forms, and support deflection."
"The new gate is not whether the demo is impressive. It is whether legal, security, and finance can see the data path and cap the usage."
Research read
Budgets are flat and reallocating. The point-solution layer in transcription, writing, forms, and BI overlays is the disruption short-list. Systems of record are durable. The likely winners bundle governed AI that replaces two or three point tools at renewal. Every figure above was elicited from the panel and is reported as observed; nothing is extrapolated beyond what the panelists stated.
7. How to use FishDog in the research workflow
FishDog fits into existing primary-research practice as a leading indicator and a complement, not a substitute.
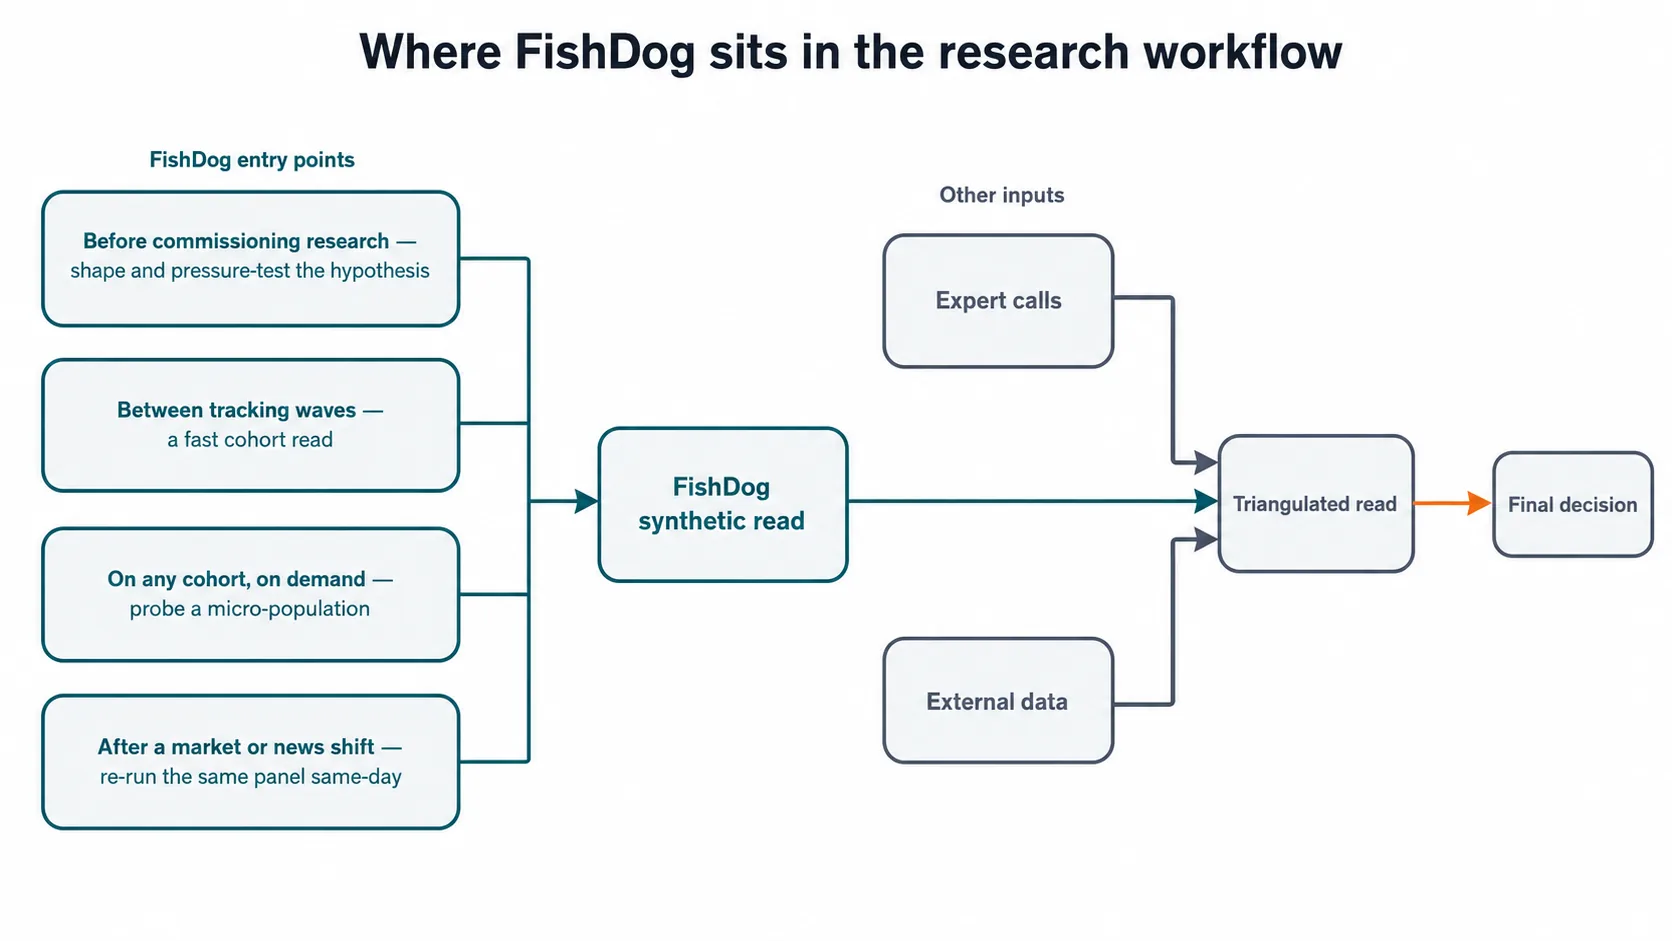
- Before commissioning expensive primary research: shape and pressure-test the hypothesis, find which questions are worth a paid human hour, and arrive better briefed.
- Between tracking waves: get a fast read on a segment or cohort when fielding a human study is too slow or too costly to justify.
- On any cohort, on demand: recruit a micro-population that no human panel has been built for, and probe it.
- After a news shift: re-run the same panel the same day to read the change, rather than waiting a quarter for the next wave.
FishDog uses it the way it suggests clients use it: as a fast, cheap, repeatable signal to triangulate against interviews and external data, with its provenance and limits stated. It is an input, not an oracle.
Where FishDog does not fit
FishDog is the wrong tool for:
- Private facts about real, named people or companies. It does not possess these by construction, which is a privacy advantage and a hard limit on what it can tell you.
- A final decision taken in isolation. It is one input to triangulate, not a verdict.
- Questions where a specific lived experience or identity is the whole answer. The literature shows that synthetic respondents can flatten and mis-portray these cases (Section 5), so FishDog leans hardest on validation and on human research here.
- Niches with little public signal to calibrate the population or inform the people in it.
8. Technical appendix: what a reviewer should be able to inspect
Population frame
- ACS/PUMS vintage used.
- Population size generated.
- Geography level and suppression rules.
- Marginals and joint distributions used for calibration.
- Average, median, and tail marginal error.
- Treatment of rare cells, sparse occupations, and small geographies.
Recruitment and enrichment
- Variables directly observed from the census/PUMS frame.
- Variables inferred or enriched after construction.
- Constraints used for firmographic and role-specific inference.
- Personality model and the number of modeled dimensions beyond the five OCEAN factors.
- Source of personality-trait distributions and how they are audited against reference data.
- Disclosure format for panel composition.
- Rules for rejecting implausible profiles.
Source grounding and source control
- Source categories used for general news, regional context, weather, trade publications, filings, and domain literature.
- Update frequency.
- Retrieval versus fine-tuning distinction.
- Source versioning and replayability.
- Rules for excluding client-provided information from the population's persistent memory.
Prompt, model, and memory control
- Base model and version.
- Prompt version.
- Population version.
- Source-context version.
- Persistent-memory schema.
- Episodic-memory retention and deletion policy.
- Re-run policy after model or prompt updates.
Benchmarking and leakage controls
- Benchmark question inventory and source.
- Holdout policy.
- Prediction-market event-selection rules.
- Measurement window.
- Metrics: mean absolute error, Brier score, calibration error, variance ratio, directional accuracy, and correlation where appropriate.
- Procedures for detecting training-data leakage.
- Procedures for detecting memory contamination.
Reporting standard
Every client-facing study should disclose:
- Panel size and composition.
- Whether attributes are observed, inferred, or supplied as role-specific source context.
- Date and time of run.
- Model, prompt, population, and source versions.
- Known limitations relevant to the study question.
- Whether results are presented as observed panel outputs or extrapolated estimates.
9. Conclusion
The inputs organizations rely on for primary research are getting noisier and more expensive. Survey panels self-select, admit fraud their own checks miss, and lose respondents every year; specialist interviews are deep but slow, costly, and converging. A synthetic method that wants to be taken seriously should not claim to equal real people. It should build from a calibrated population, recruit rather than invent, benchmark against real-world ground truth, and state its limits. That is the standard FishDog holds itself to.
References
- Aher, G., Arriaga, R. I., & Kalai, A. T. (2023). Using large language models to simulate multiple humans and replicate human subject studies. ICML 2023, PMLR 202, 337–371.
- Argyle, L. P., Busby, E. C., Fulda, N., Gubler, J. R., Rytting, C., & Wingate, D. (2023). Out of one, many: Using language models to simulate human samples. Political Analysis, 31(3), 337–351.
- Arora, N., Chakraborty, I., & Nishimura, Y. (2025). AI–human hybrids for marketing research: Leveraging large language models (LLMs) as collaborators. Journal of Marketing, 89(2), 43–70.
- Beckman, R. J., Baggerly, K. A., & McKay, M. D. (1996). Creating synthetic baseline populations.00004-3) Transportation Research Part A, 30(6), 415–429.
- Berg, J. E., Nelson, F. D., & Rietz, T. A. (2008). Prediction market accuracy in the long run. International Journal of Forecasting, 24(2), 285–300.
- Bisbee, J., Clinton, J. D., Dorff, C., Kenkel, B., & Larson, J. M. (2024). Synthetic replacements for human survey data? The perils of large language models. Political Analysis, 32(4), 401–416.
- Boelaert, J., Coavoux, S., Ollion, É., Petev, I., & Präg, P. (2025). Machine bias: How do generative language models answer opinion polls? Sociological Methods & Research, 54(3), 1156–1196.
- Brand, J., Israeli, A., & Ngwe, D. (2023). Using LLMs for market research. Harvard Business School working paper.
- Chapekis, A., et al. (2026). Can AI stand in for human survey-takers? Not really. Pew Research Center, 30 September.
- Chuang, Y.-S., Nirunwiroj, K., Studdiford, Z., Goyal, A., Frigo, V. V., Yang, S., Shah, D., Hu, J., & Rogers, T. T. (2024). Beyond demographics: Aligning role-playing LLM-based agents using human belief networks. Findings of EMNLP 2024.
- Deming, W. E., & Stephan, F. F. (1940). On a least squares adjustment of a sampled frequency table when the expected marginal totals are known. Annals of Mathematical Statistics, 11(4), 427–444.
- Dominguez-Olmedo, R., Hardt, M., & Mendler-Dünner, C. (2024). Questioning the survey responses of large language models. NeurIPS 2024.
- Duess, A. (2026). Asking people: The current state of human research, 2026. FishDog.
- Feng, S., Park, C. Y., Liu, Y., & Tsvetkov, Y. (2023). From pretraining data to language models to downstream tasks. ACL 2023, 11737–11762.
- Goldberg, L. R. (1990). An alternative "description of personality": The Big-Five factor structure. Journal of Personality and Social Psychology, 59(6), 1216–1229.
- Halawi, D., Zhang, F., Yueh-Han, C., & Steinhardt, J. (2024). Approaching human-level forecasting with language models. NeurIPS 2024.
- Hewitt, L., Ashokkumar, A., Ghezae, I., & Willer, R. (2024). Predicting results of social science experiments using large language models. Working paper.
- Hu, T., & Collier, N. (2024). Quantifying the persona effect in LLM simulations. ACL 2024.
- John, O. P., & Srivastava, S. (1999). The Big Five trait taxonomy. In Handbook of Personality (2nd ed., pp. 102–138). Guilford Press.
- Karger, E., Bastani, H., Yueh-Han, C., Jacobs, Z., Halawi, D., Zhang, F., & Tetlock, P. E. (2025). ForecastBench: A dynamic benchmark of AI forecasting capabilities. ICLR 2025.
- Kennedy, C., & Hartig, H. (2019). Response rates in telephone surveys have resumed their decline. Pew Research Center, 27 February.
- Kennedy, C., Hatley, N., Lau, A., Mercer, A., Keeter, S., Ferno, J., & Asare-Marfo, D. (2020). Assessing the risks to online polls from bogus respondents. Pew Research Center, 18 February.
- Lee, S., Peng, T.-Q., Goldberg, M. H., Rosenthal, S. A., Kotcher, J. E., Maibach, E. W., & Leiserowitz, A. (2024). Can large language models estimate public opinion about global warming? An empirical assessment of algorithmic fidelity and bias. PLOS Climate, 3(8), e0000429.
- Li, P., Castelo, N., Katona, Z., & Sarvary, M. (2024). Frontiers: Determining the validity of large language models for automated perceptual analysis. Marketing Science, 43(2), 254–266.
- Little, R. J. A. (1993). Post-stratification: A modeler's perspective. Journal of the American Statistical Association, 88(423), 1001–1012.
- McCrae, R. R., & Costa, P. T. (1987). Validation of the five-factor model of personality across instruments and observers. Journal of Personality and Social Psychology, 52(1), 81–90.
- Mercer, A., & Lau, A. (2023). Comparing two types of online survey samples. Pew Research Center, 7 September.
- Moon, S., Abdulhai, M., Kang, M., Suh, J., et al. (2024). Virtual personas for language models via an anthology of backstories. EMNLP 2024.
- NORC at the University of Chicago. (2026). Fraudulent respondents and bots in nonprobability surveys: A literature review. Research brief, April.
- Park, J. S., et al. (2026). LLM agents grounded in self-reports enable general-purpose simulation of individuals. arXiv:2411.10109v3.
- Pew Research Center. (2018). How different weighting methods work.
- Santurkar, S., Durmus, E., Ladhak, F., Lee, C., Liang, P., & Hashimoto, T. (2023). Whose opinions do language models reflect? ICML 2023, PMLR 202, 29971–30004.
- Schoenegger, P., Tuminauskaite, I., Park, P. S., Bastos, R. V. S., & Tetlock, P. E. (2024). Wisdom of the silicon crowd: LLM ensemble prediction capabilities rival human crowd accuracy. Science Advances, 10(45).
- Soto, C. J., & John, O. P. (2017). The next Big Five Inventory (BFI-2): Developing and assessing a hierarchical model with 15 facets to enhance bandwidth, fidelity, and predictive power. Journal of Personality and Social Psychology, 113(1), 117–143.
- Tjuatja, L., Chen, V., Wu, T., Talwalkar, A., & Neubig, G. (2024). Do LLMs exhibit human-like response biases? A case study in survey design. Transactions of the ACL, 12, 1011–1026.
- Toubia, O., Gui, G. Z., Peng, T., Merlau, D. J., Li, A., & Chen, H. (2025). Twin-2K-500: A data set for building digital twins of over 2,000 people based on their answers to over 500 questions. Marketing Science, 44(6), 1446–1455.
- Wang, A., Morgenstern, J., & Dickerson, J. P. (2025). Large language models that replace human participants can harmfully misportray and flatten identity groups. Nature Machine Intelligence, 7(3), 400–411.
- Westwood, S. J. (2025). The potential existential threat of large language models to online survey research. PNAS, 122(47).
- Williamson, P., Birkin, M., & Rees, P. H. (1998). The estimation of population microdata by using data from Small Area Statistics and Samples of Anonymised Records. Environment and Planning A, 30(5), 785–816.
- Wolfers, J., & Zitzewitz, E. (2004). Prediction markets. Journal of Economic Perspectives, 18(2), 107–126.
U.S. Census Bureau. American Community Survey and Public Use Microdata Sample (PUMS).
University of Michigan, Survey Research Center, Institute for Social Research. Surveys of Consumers (Index of Consumer Sentiment), founded 1946.
Disclosures
This document is provided for information purposes only. Synthetic-population research is a complement to, not a replacement for, other primary research, and should be triangulated against independent sources. FishDog is responsible for the methodology and claims in this paper. Academic studies cited explain the science and the feasibility of the approach; they are not independent validations of FishDog.
FishDog methodology standard: this document commits to the validation framework described in Section 4 and to disclosing sample composition and known limitations on every study. Figures attributed to panels are reported as observed and are not extrapolated beyond the elicited responses unless explicitly labeled as modeled estimates. Panelist quotations are from synthetic respondents.
FishDog · fish.dog · Contact: [email protected] · © 2026 FishDog.
Synthetic Populations: How FishDog Builds, Calibrates, and Validates Them
Download the PDF